Nippon Silver ETF vs Physical Silver: Price Deviation Analyst

- Introduction: The Structural Shift in Indian Silver Markets
- Quick Summary: Key Valuation Metrics for 2026
- The Three Prices of Silver: A Layered Valuation Framework
- Mechanics of Deviation: Unpacking the Tracking Gaps
- The iNAV Protocol: Identifying Fair Value in Real-Time
- Physical vs. Digital: An In-Depth Comparison of Spreads
- The Analyst’s Compendium: Market Cycles, Regulations, and Execution
- Conclusion: Strategic Outlook for Silver Investors
Introduction: The Structural Shift in Indian Silver Markets
The Indian financial ecosystem has witnessed a paradigm shift in the perception and utilization of silver as an asset class. Traditionally relegated to the realms of jewelry and silverware, silver has emerged in early 2026 as a sophisticated industrial and investment vehicle. This evolution mirrors its global transformation into the “white gold” of the renewable energy transition.
For the modern Indian investor, the primary point of friction remains the Nippon Silver ETF vs Physical Silver price deviation. This phenomenon has complicated the pursuit of fair value during periods of extreme market stress. Understanding this deviation is no longer optional for those seeking capital preservation in the commodities space.
Silver’s dual nature as both a precious and industrial metal places it in a unique position within a diversified portfolio. Its industrial utility is critical for solar photovoltaics, electric vehicle (EV) batteries, 5G infrastructure, and advanced electronics. This has created a structural supply-demand deficit that has persisted since 2021.
As global silver prices broke through historic psychological barriers in late 2025, reaching toward $95 and eventually $120 per troy ounce, the Indian market experienced a massive influx of capital into digital silver products. The Nippon India Silver ETF (SILVERBEES), being the most liquid vehicle in the segment, became the epicenter of this trend. This popularity frequently resulted in a significant Nippon Silver ETF vs Physical Silver price deviation.
Quick Summary: Key Valuation Metrics for 2026
The following table summarizes the essential performance and cost metrics for the Indian silver market as of February 17, 2026.
| Feature | Nippon India Silver ETF (SILVERBEES) | Physical Silver Bullion (999 Fine) |
|---|---|---|
| Primary Driver | Domestic Price of Silver Index | LBMA Spot + Duty + INR/USD |
| Expense Ratio | 0.56% (Annualized) | 0% (Annual) |
| Upfront Taxes | 3% GST (Implicit in NAV) | 3% GST (Paid Upfront) |
| Import Duty | 6% (BCD 5% + AIDC 1%) | 6% (Paid on Landed Value) |
| Storage Cost | Zero (Factored in Expense Ratio) | ₹2,000 – ₹10,000 / Year (Locker) |
| Liquidity | High (Secondary Market Trading) | Low (Jeweler/Dealer Dependent) |
| Premium Risk | High during supply shortages | Low (Limited to Dealer Margin) |
| 1-Year Return | 163.33% (as of Feb 2026) | ~162% (Spot Price Basis) |
Pro-Tip: Avoiding the Premium Trap During periods of high volatility, the market price of an ETF can detach from its iNAV. Always use Limit Orders instead of Market Orders. A limit order ensures your trade executes only at your specified price, preventing you from accidentally buying into a 10-15% Nippon Silver ETF vs Physical Silver price deviation during a retail demand surge.
The Three Prices of Silver: A Layered Valuation Framework
To properly investigate the Nippon Silver ETF vs Physical Silver price deviation, one must first identify which “price” is being used as the benchmark. In the Indian market, silver valuation is a multi-layered process involving international benchmarks, domestic regulatory levies, and secondary market demand-supply dynamics.
1. LBMA International Spot Price (USD)
The foundational layer of silver pricing is the London Bullion Market Association (LBMA) Silver daily spot-fixing price. This is the global benchmark for 99.9% pure silver, quoted in US Dollars per troy ounce. This price is driven by global macroeconomic factors, including Federal Reserve interest rate decisions and worldwide industrial consumption.
2. Indian Physical Spot Price (INR)
The domestic price is a derived value that incorporates the LBMA spot price but adds several layers of cost. The landed cost in India includes the Basic Customs Duty (BCD) of 5% and the Agriculture Infrastructure and Development Cess (AIDC) of 1%. Combined, these factors—along with local bullion premiums and GST—create a landed cost that is typically 10-14% higher than the international parity price.
3. ETF Market Price (SILVERBEES)
The third layer is the price at which the Nippon India Silver ETF trades on the NSE or BSE. While this price is intended to track the Indian Physical Spot Price (the NAV), it is influenced by the immediate demand-supply of ETF units in the secondary market. When retail demand is excessive, the market price rises above the NAV, resulting in a Nippon Silver ETF vs Physical Silver price deviation.
Mechanics of Deviation: Unpacking the Tracking Gaps
The Nippon Silver ETF vs Physical Silver price deviation is the result of three distinct operational and market-driven factors: Tracking Error, Tracking Difference, and Liquidity Premia.
1. Tracking Error and Operational Friction
Tracking error measures the volatility of the difference between the ETF’s daily returns and the returns of physical silver. For the Nippon India Silver ETF, the tracking error as of early 2026 is approximately 0.44%. This deviation arises from fund expenses, such as the annual fee of 0.56% used for storage in professional vaults, insurance, and administration.
2. Tracking Difference and the Cash Drag
Tracking difference is the total divergence in returns over a specific period. A primary driver is “Cash Drag”. Under SEBI regulations, a silver ETF must invest at least 95% of its assets in physical silver, with the remaining 5% often held in cash or equivalents to facilitate immediate redemptions. This uninvested cash creates a performance gap during sharp rallies.
3. Liquidity Premia and Speculative Bubbles
This is the most critical component of the Nippon Silver ETF vs Physical Silver price deviation. In late 2025, a severe domestic silver shortage made it impossible for Authorized Participants to source 99.9% pure silver bars at fair prices. Consequently, the creation of new units was suspended by several AMCs. Without new supply, retail buyers bid up the existing units on the exchange, pushing premiums to record highs of 10% to 19%.
The iNAV Protocol: Identifying Fair Value in Real-Time
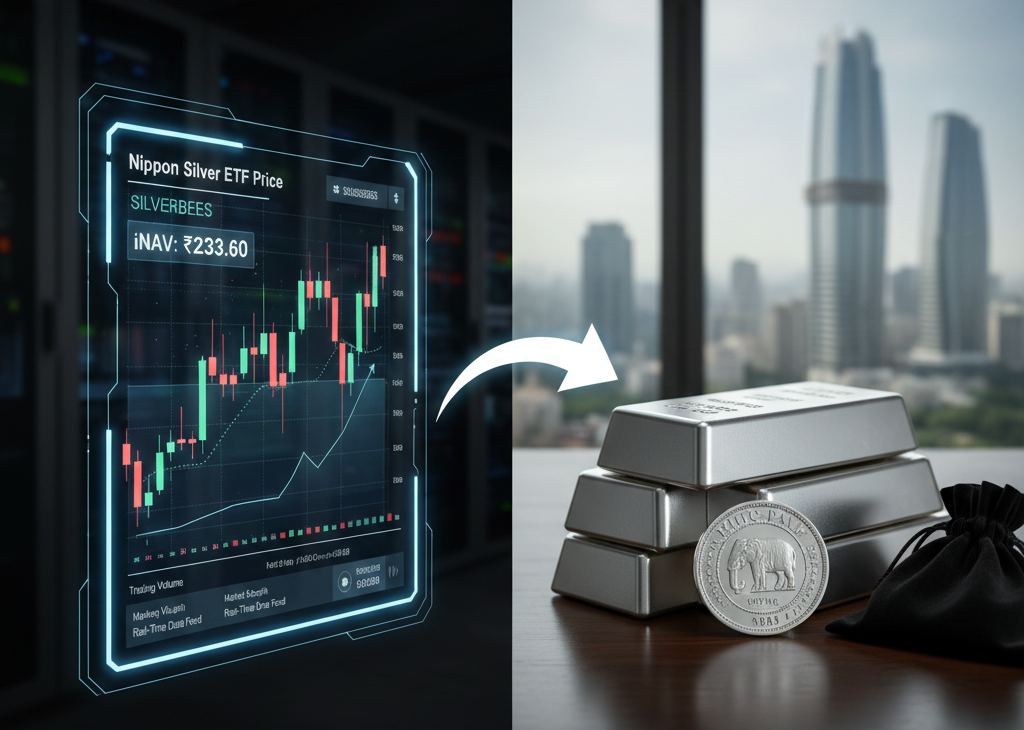
To protect against the Nippon Silver ETF vs Physical Silver price deviation, investors must use the Indicative Net Asset Value (iNAV). The iNAV is a real-time estimate of the ETF’s fair value per share, calculated and published every 15 seconds during market hours.
Step-by-Step Guide to Checking iNAV on the NSE Website
- Access the Quote Page: Navigate to the official NSE website (www.nseindia.com).
- Search for the Ticker: Ensure you are looking at
SILVERBEES. - Locate the i-NAV Field: Under the “Price Information” or “Trade Information” tab, search for the field specifically labeled “i-NAV” .
- Compare to LTP: Check the “Last Traded Price” (LTP). As of February 13, 2026, the i-NAV for SILVERBEES was recorded at ₹233.60, providing a benchmark against the market price.
- Assess the Spread: If the LTP is significantly higher than the i-NAV, the fund is trading at a premium. In such cases, wait for the premium to normalize.
Physical vs. Digital: An In-Depth Comparison of Spreads
When assessing the Nippon Silver ETF vs Physical Silver price deviation, investors must weigh the “Digital Premium” against the “Physical Friction”.
1. Physical Silver: The Cost of Tangibility
Buying physical bars or coins involves several upfront costs. For 1kg silver bars, refiners like MMTC-PAMP charge between 3% and 8% over the spot price for craftsmanship. Reselling physical silver often requires an assaying test, and jewelers typically buy back silver at a 5-10% discount.
2. Digital Silver: The Cost of Convenience
The Nippon India Silver ETF removes the logistical burden but introduces different variables. Secondary costs include the Bid-Ask Spread—the difference between the highest buy price and the lowest sell price. For SILVERBEES, this spread is usually narrow (0.01% – 0.05%), but it can widen significantly during market turmoil.
The Analyst’s Compendium: Market Cycles, Regulations, and Execution
This section consolidates critical data regarding market volatility, regulatory protections, fund performance, and execution tactics to manage the Nippon Silver ETF vs Physical Silver price deviation effectively.
1. Case Study: The 2026 “Bloodbath” and Premium Collapse
February 2026 served as a brutal reminder of silver’s volatility. On February 1, 2026, silver opened at a record high of ₹3,50,000 per kg due to speculative frenzy and import duty hike rumors . By February 17, prices had collapsed to ₹2,60,000 per kg—a 25.7% decline in 17 days . As the market crashed, the extreme 19% premiums seen in late 2025 vanished instantly, with funds like SILVERBEES falling nearly 30% in a single week.
2. Regulatory Oversight: SEBI Operating Norms
To mitigate price dislocations, SEBI mandates strict operating guidelines :
- Purity & Verification: Every unit must be backed by 99.9% fine silver conforming to LBMA Good Delivery Standards, with statutory audits every six months .
- Asset Allocation: A minimum of 95% of assets must be in physical silver or silver-related instruments, with cash capped at 5% .
- Tracking Disclosure: AMCs must disclose tracking error and difference monthly. SEBI mandates an endeavor to keep tracking error below 2% .
3. Comparative Performance Analysis
While Nippon India Silver ETF is the liquidity leader, other funds offer competitive structures.
| Fund Name | Ticker | AUM (₹ Cr) | Expense Ratio | 1Y Return (%) | Tracking Error |
| Nippon India Silver ETF | SILVERBEES | 28,944 | 0.56% | 163.33% | 0.44% |
| ICICI Pru Silver ETF | SILVERIETF | 14,847 | 0.40% | 164.22% | 0.40% |
| HDFC Silver ETF | HDFCSILVER | 7,411 | 0.45% | 164.33% | 0.45% |
| SBI Silver ETF | SBISILVER | 5,586 | 0.40% | 163.76% | 0.40% |
| Aditya BSL Silver ETF | SILVER | 2,949 | 0.35% | 163.87% | ~0.45% |
4. Strategic Execution Tactics
- The 2% Rule: Avoid buying any ETF if the secondary market price is more than 2% above the iNAV.
- Limit Order Protocol: Use a Limit Order placed within 0.1% of the current iNAV to ensure execution at fair value.
- The SIP Strategy: For long-term investors, using a Systematic Investment Plan in a Silver Fund of Fund (FoF) is safer. FoFs transact at end-of-day NAV, bypassing intraday Nippon Silver ETF vs Physical Silver price deviation .
Conclusion: Strategic Outlook for Silver Investors
The investigation into the Nippon Silver ETF vs Physical Silver price deviation reveals a market prone to significant dislocation during periods of structural stress. The 2025-2026 cycle has proven that “buying silver” is not the same as “buying a silver ETF at the right price.” As seen in the recent market reversal, the disappearance of a 19% premium during a price collapse is a permanent loss of capital that cannot be recovered even if the metal’s price eventually rebounds.
Investors must distinguish between the long-term industrial thesis for silver and the short-term technical risks of the ETF structure. For a deeper dive into the specific catalysts—ranging from Federal Reserve policy shifts to the unwinding of speculative long positions—that triggered the current downturn, read our detailed report: Why Silver Prices Crashed in 2026: An Investor’s Guide to the “White Metal” Crisis.
Ultimately, the Indicative Net Asset Value (iNAV) must become the primary lens through which every transaction is viewed. By aligning digital investments with physical reality and respecting the operational limits of AMCs, investors can harness the long-term potential of silver without falling victim to the technical distortions of the secondary market.