Active vs Passive ETF Fees 2026: Is the Alpha Worth the Premium?
- The 2026 ETF Watershed Moment: A Paradigm Shift in Active Management
- The Fee Breakdown: Unpacking Asset-Weighted vs. Equal-Weighted Realities
- Active ETFs in 2026: The Surge of Factor Rotation and Income Enhancement
- The Hybrid "Middle Ground": Defining the Alpha Enhanced Strategies
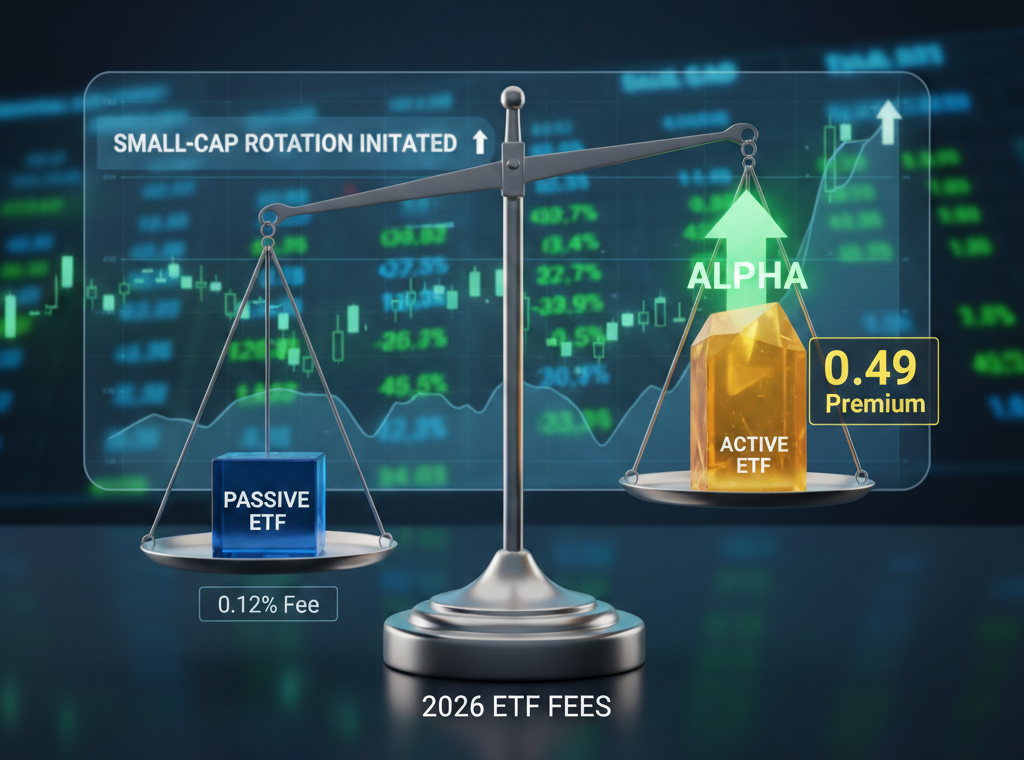
- The Small-Cap Rotation: Why Passive Indices May Fail in 2026
- Fixed Income Evolution: Active Management in a 3.5% Rate Environment
- Direct Indexing vs. Active ETFs: Costs, Customization, and Tax-Loss Harvesting
- The "One Big Beautiful Bill" Act (OBBBA): Navigating 2026 Tax Efficiency
- Interactive Analysis: The ETF Fee Calculator Logic and Long-Term Impact
- Conclusion: The Core-Satellite Model and the Path Forward
The 2026 ETF Watershed Moment: A Paradigm Shift in Active Management
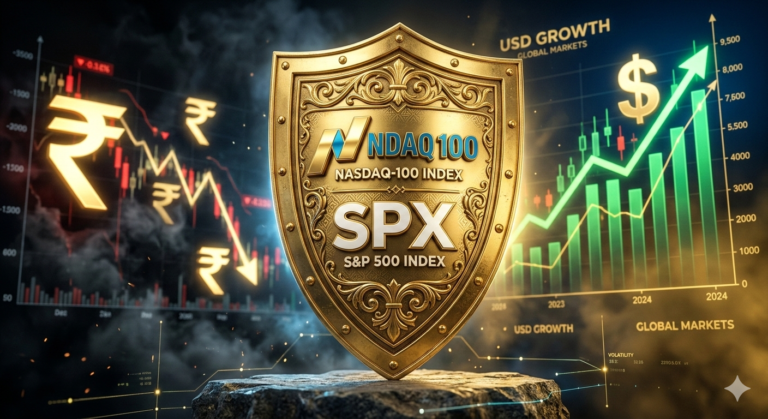
As of early 2026, the global financial landscape is grappling with the shift in Active vs Passive ETF fees 2026, a metric that has redefined how advisors allocate capital. The global financial markets are currently witnessing what senior analysts have dubbed the “ETF Watershed Moment.” For the first time in history, the number of actively managed ETFs in the market has not only rivaled but essentially eclipsed the count of passive, index-tracking products .
The total assets in U.S.-listed ETFs have surged to approximately $14 trillion. Within this massive pool, active strategies are punching far above their weight. While they represent roughly 10% to 15% of total managed assets, they accounted for nearly 37% of all net flows in early 2026 and an astonishing 82% of all new fund launches. The problem facing many investors today is the “Beta Trap”—a scenario where the historic concentration in a few large-cap technology stocks has made broad-market passive indices increasingly vulnerable to sector corrections.
This evolution is heavily monitored by the(), which recently highlighted that active ETFs now rival passive funds in number, reflecting a permanent shift toward actively managed strategies. The regulatory tailwinds of Rule 6c-11 have finally bridged the gap between the intellectual capital of traditional active managers and the operational benefits of the ETF vehicle. Consequently, the debate surrounding Active vs Passive ETF fees 2026 is no longer a race to zero, but a quest for “High-Efficiency Alpha”—the ability to capture market-beating returns at a price point that doesn’t erode long-term gains .
The Fee Breakdown: Unpacking Asset-Weighted vs. Equal-Weighted Realities
When examining active vs passive ETF fees 2026, the headline figures can be misleading without a deeper dive into the methodology of the calculations. In 2026, the asset-weighted average expense ratio for passive ETFs remains anchored at approximately 0.12%. This low figure is heavily influenced by the “Big Three” issuers—BlackRock, Vanguard, and State Street—who control at least 87% of passive ETF assets and utilize their massive scale to drive costs toward zero for core holdings like the S&P 500 or Total Bond Market.
In contrast, the asset-weighted average for active ETFs has compressed to 0.49%. While this is significantly higher than passive costs, it represents a monumental victory for investors when compared to the 0.80% to 1.10% fees historically associated with active mutual funds. However, the DERA report from February 2026 notes a stark difference when looking at equal-weighted metrics.
The reason for the 0.70% equal-weighted average in the active space is the proliferation of newer, specialized “niche” funds that have not yet achieved the scale necessary to lower their expense ratios. For the savvy analyst, this data suggests that the “sticker price” of an active fund is often a function of its maturity and asset base. Larger, established active issuers like Dimensional Fund Advisors and J.P. Morgan are able to offer strategies at 0.25% to 0.35%, effectively competing with thematic passive funds.
The implications of this fee gap are profound for a $100,000 portfolio. A 37-basis point difference may seem negligible on an annual basis, but over a decade, it represents thousands of dollars in compounding drag. Therefore, the central question for 2026 is not whether active is “too expensive,” but whether the active manager can generate at least 40 basis points of gross alpha to justify the premium. In the current environment of market “k-shaped” recovery and sector rotation, the evidence suggests that certain active “Alpha-Enhanced” and fixed-income strategies are clearing this hurdle with ease.
Active ETFs in 2026: The Surge of Factor Rotation and Income Enhancement
A defining characteristic of the 2026 market is the transition from “discretionary” active management—where a single manager picks stocks based on intuition—to “systematic” active management, which uses massive data sets and algorithmic rigor. Leading this charge are flagship products like the iShares U.S. Equity Factor Rotation Active ETF (DYNF) and the iShares U.S. Large Cap Premium Income Active ETF (BALI).
The DYNF strategy is particularly relevant in 2026 because it seeks outperformance by dynamically rotating between five key style factors: quality, value, size, minimum volatility, and momentum. With an expense ratio of just 0.26%, DYNF provides a sophisticated, multi-factor approach for a fee that is only marginally higher than many “Smart Beta” passive funds. In 2025, DYNF outperformed its benchmark by over 200 basis points, proving that factor-based active management can successfully navigate the “policy fog” of a mid-cycle economy.
Meanwhile, the BALI ETF has become a staple for income-hungry investors. By combining a systematic large-cap stock selection process with a call-option-writing strategy, BALI targets consistent monthly income with lower volatility than the broader S&P 500. In an environment where interest rates have stabilized but dividend yields remain under pressure, BALI’s 6.75% distribution rate offers a compelling alternative to traditional high-yield bonds. The fund’s 0.35% expense ratio is a small price to pay for a strategy that managed to capture market upswings while providing a “volatility buffer” during the turbulent start to 2026.
These funds represent the “new breed” of active ETFs that focus on “downside protection” and “income enhancement” rather than just “swinging for the fences”. The professional consensus is that in a 2026 market defined by geopolitical risks and uneven economic data, paying a 15–25 basis point premium for a manager who can actively “trim the sails” during a storm is a prudent risk-management decision.
The Hybrid “Middle Ground”: Defining the Alpha Enhanced Strategies
For years, the investment world was bifurcated into “Pure Passive” (cheap but dumb) and “High-Conviction Active” (smart but expensive). In 2026, the most significant innovation in portfolio construction is the rise of the Alpha Enhanced strategy. These are low-tracking-error portfolios that seek to optimize the risk budget by holding a large number of names and placing many small “bets” rather than making bold, high-conviction calls.
Goldman Sachs has emerged as a pioneer in this “middle ground,” offering Alpha Enhanced ETFs that evaluate over 15,000 stocks daily using proprietary data-driven models. These funds, such as the Goldman Sachs Alpha Enhanced U.S. Equity Active UCITS ETF (GQUS), are priced at a net expense ratio of only 0.20%. This pricing is critical; it represents a mere 10–15 basis point premium over traditional passive products.
Why Alpha Enhanced is the “Golden Mean” of 2026:
- Alpha Efficiency: By focusing on consistency rather than magnitude, these funds aim for higher “alpha efficiency” at lower tracking-error levels.
- Cost Effectiveness: Expense ratios are only slightly higher than passive funds, and these costs are often entirely offset by the modest alpha generated through systematic security selection.
- Risk Management: These portfolios use rigorous risk management to ensure that sector and macro exposures align closely with the benchmark, allowing stock-picking to be the primary driver of returns.
Institutional investors have gradually embraced these use cases because they allow for “incremental enhancements” without the volatility associated with concentrated active bets. In Europe, investors are increasingly willing to pay a modest 10 basis point premium for “research-enhanced” or “income-enhanced” ETFs that promise predictable outcomes in an otherwise unpredictable market. This “a little active goes a long way” philosophy is fundamentally reshaping the core-satellite allocation model for 2027 and beyond.
The Small-Cap Rotation: Why Passive Indices May Fail in 2026
The “Small-Cap Rotation” of 2026 is perhaps the most documented market shift of the decade. After years of large-cap growth dominance, the S&P 500 became historically overvalued, trading at over 23x earnings. In contrast, high-quality small caps, as measured by the S&P 600, began 2026 trading at 15.5x–16.0x earnings—a full standard deviation below their 10-year median.
However, passive small-cap indexing is fraught with danger in 2026. Broad indices like the Russell 2000 are often littered with “zombie companies”—unprofitable firms that are highly sensitive to even minor interest rate fluctuations. This is where the debate of active vs passive ETF fees 2026 takes a turn toward quality. Active managers like Dimensional Fund Advisors (DFA) and Avantis Investors provide a “better shake” by screening out these unprofitable names and focusing on firms with healthy margins and strong free cash flow.
The data shows that active small-cap value funds have delivered market-beating returns (alpha) that far exceed the 15–20 basis point fee premium they charge over passive peers. By overweighting “profitable” and “cheap” companies, managers like DFA have historically achieved 7.4% annualized returns over a decade, outperforming the broad Russell 2000 benchmark significantly. In 2026, where the “junk rally” of 2025 is expected to fizzle, this focus on “Quality-Value” is anticipated to be the primary driver of outperformance.
Fixed Income Evolution: Active Management in a 3.5% Rate Environment
If equities are the “innovative frontier” for active ETFs, fixed income is the “dominant fortress.” In 2025, active fixed income ETFs took in $178 billion, representing a massive 40% of all fixed income ETF flows. This preference for active management in bonds is driven by the fact that bond indices are often “flawed” by design—they give the highest weights to the most indebted issuers.
In 2026, with the Federal Reserve having cut rates to the 3.5%–3.75% range, the bond market is facing significant “headline risk” and “policy fog”. Passive bond ETFs are “tied to an index” and cannot rotate between short and long duration or shift credit exposure when inflation data surprises the market. Active portfolios, however, can navigate these structural inefficiencies, managing interest-rate movements and the creditworthiness of issuers with bottom-up security selection.
Vanguard has responded to this trend by ensuring that 100% of its active fixed income ETFs are priced in the lowest-cost decile of their peer groups. However, even with low fees, the value proposition of active fixed income lies in risk mitigation. Professional managers can avoid the “extension risk” and “prepayment risk” inherent in mortgage-backed securities (MBS) and collateralized loan obligations (CLOs) as market yields fluctuate. For many advisors in 2026, active bond ETFs have become the “preferred tool” for generating alpha in a landscape where traditional bond benchmarks offer limited flexibility.
Direct Indexing vs. Active ETFs: Costs, Customization, and Tax-Loss Harvesting
As we analyze active vs passive ETF fees 2026, a third competitor has entered the arena: Direct Indexing. This strategy allows investors to own the individual stocks of an index directly, rather than through a fund wrapper. This provides the ultimate level of customization—such as excluding specific industries or companies for ESG reasons—and allows for “security-level” tax-loss harvesting.
However, direct indexing is often more expensive and complex than using active ETFs. While ETFs are typically the “most cost-effective” option for broad exposure, direct indexing fees can be justified for high-net-worth clients who can benefit from the significant tax optimization of harvesting losses in individual stocks even when the broad index is up.
In 2026, many savvy investors are using a “hybrid” approach: utilizing direct indexing for their core U.S. large-cap exposure to maximize tax-loss harvesting, while using active ETFs to access more specialized segments like international small-caps or emerging market credit where individual stock management is too complex or costly.
The “One Big Beautiful Bill” Act (OBBBA): Navigating 2026 Tax Efficiency
The tax landscape of 2026 has been fundamentally reshaped by the “One Big Beautiful Bill Act” (OBBBA), signed into law in July 2025. This legislation made several permanent changes to the tax code that impact how investors evaluate active vs passive ETF fees 2026.
- SALT Cap Increase: The SALT deduction cap was raised to $40,000, which has changed the calculus for high-income earners in “high-tax” states.
- Capital Gains Brackets: Inflation-adjusted thresholds for 2026 mean more income can be taxed at the 0% and 15% long-term capital gains rates compared to previous years.
- Standard Deduction: Increased to $32,200 for married couples filing jointly, providing a larger buffer against taxable income.
In this environment, “Tax-Aware” active management has become a critical differentiator. Active ETFs are inherently more tax-efficient than mutual funds because they use “in-kind” redemption mechanisms to avoid realizing capital gains when rebalancing. Furthermore, active managers in 2026 are increasingly using systematic tax-loss harvesting within the ETF wrapper to offset realized gains, potentially increasing yearly expected returns by up to 10 basis points. For a high-tax-bracket investor, the tax “drag” of an inefficient mutual fund can be as much as 48 basis points per year—meaning the “hidden” cost of a mutual fund can exceed the entire expense ratio of an active ETF.
Interactive Analysis: The ETF Fee Calculator Logic and Long-Term Impact
To truly understand if the alpha is worth the premium, we must apply the logic of an “ETF Fee Calculator” to a typical 2026 portfolio. Seemingly tiny percentage differences in expense ratios create massive gaps in wealth over long horizons because fees are deducted from the fund’s returns daily, essentially “compounding in reverse”.
The $100,000 Portfolio Scenario (10 Years at 8% Return):
- Scenario A (Passive ETF): 0.12% fee. 10-year value: $213,561.
- Scenario B (Active Alpha Enhanced): 0.30% fee. 10-year value: $209,920.
- Scenario C (Traditional Active): 0.49% fee. 10-year value: $206,356.
The “Alpha Requirement”: To justify the move from Scenario A to Scenario C, an active manager must generate a net-of-fee return that exceeds the passive return. Specifically, the manager must generate at least 0.37% (37 basis points) of annual “excess return” (alpha) just to break even.
In a low-volatility, “up-only” market, this 37 bps hurdle is difficult to clear. However, in the 2026 environment of high dispersion and sector rotation, active small-cap and international managers have shown they can generate alpha in the range of 100–300 basis points, making the 37 bps fee premium one of the “best ROI moves” an investor can make.
How to Allocate Your 2026 Portfolio
- Buy Passive ETFs if: You want a low-cost “core” for U.S. large-cap exposure and are comfortable with the historic concentration in tech mega-caps.
- Buy Active ETFs if: You are targeting the 2026 Small-Cap Rotation, need downside protection in a volatile market, or want professional management in the complex bond market.
- Buy Alpha Enhanced Hybrid if: You want a “best of both worlds” approach with consistent, modest outperformance for only a 10–15 bps fee premium.
- Buy Direct Indexing if: You are a high-net-worth investor ($250k+ account) who needs extreme tax-loss harvesting or highly personalized ESG constraints.
Conclusion: The Core-Satellite Model and the Path Forward
The analysis of active vs passive ETF fees 2026 leads to a decisive conclusion: the binary choice between “active” and “passive” is a relic of the past. The modern, sophisticated portfolio of 2026 is built on a “Core-Satellite” architecture that leverages the unique strengths of each vehicle. By using low-cost passive ETFs (0.12%) as your broad “Core,” you maintain institutional-level expense ratios. However, deploying “Satellite” positions in active funds like DYNF (0.26%) or AVUV (0.25%) allows you to capture the specific factor premiums and structural rotations—like the 2026 Small-Cap pivot—that define today’s market.
Strategic Portfolio Positioning
While understanding fee dynamics is essential, the real value lies in execution. Navigating the Small-Cap Rotation requires more than just picking a low-cost fund; it demands a deep understanding of which sectors are poised for a “Quality-Value” breakout. To help you structure your “Core” before adding these active satellites, check out our Ultimate Guide to 2026 Portfolio Allocation Strategies. This resource breaks down the exact percentages for balancing passive stability with high-alpha potential.
Institutional Insights & Regulatory Data
As the ETF landscape evolves, staying updated with official data is crucial for precise benchmarking. For a deeper dive into structural market shifts and to verify the latest expense ratio trends, explore the SEC’s Division of Economic and Risk Analysis (DERA). Their research provides the foundational transparency defining this 2026 “Watershed Moment.”
Ultimately, as we look toward 2027, the focus must remain on “Net Alpha”—the return remaining after fees and taxes. In a world of increasing complexity, a “little active” may indeed go a long way toward securing long-term wealth.