Strategic Evaluation of Operation Epic Fury: Geopolitical Volatility and the Structural Repricing of Indian Equity Markets in March 2026
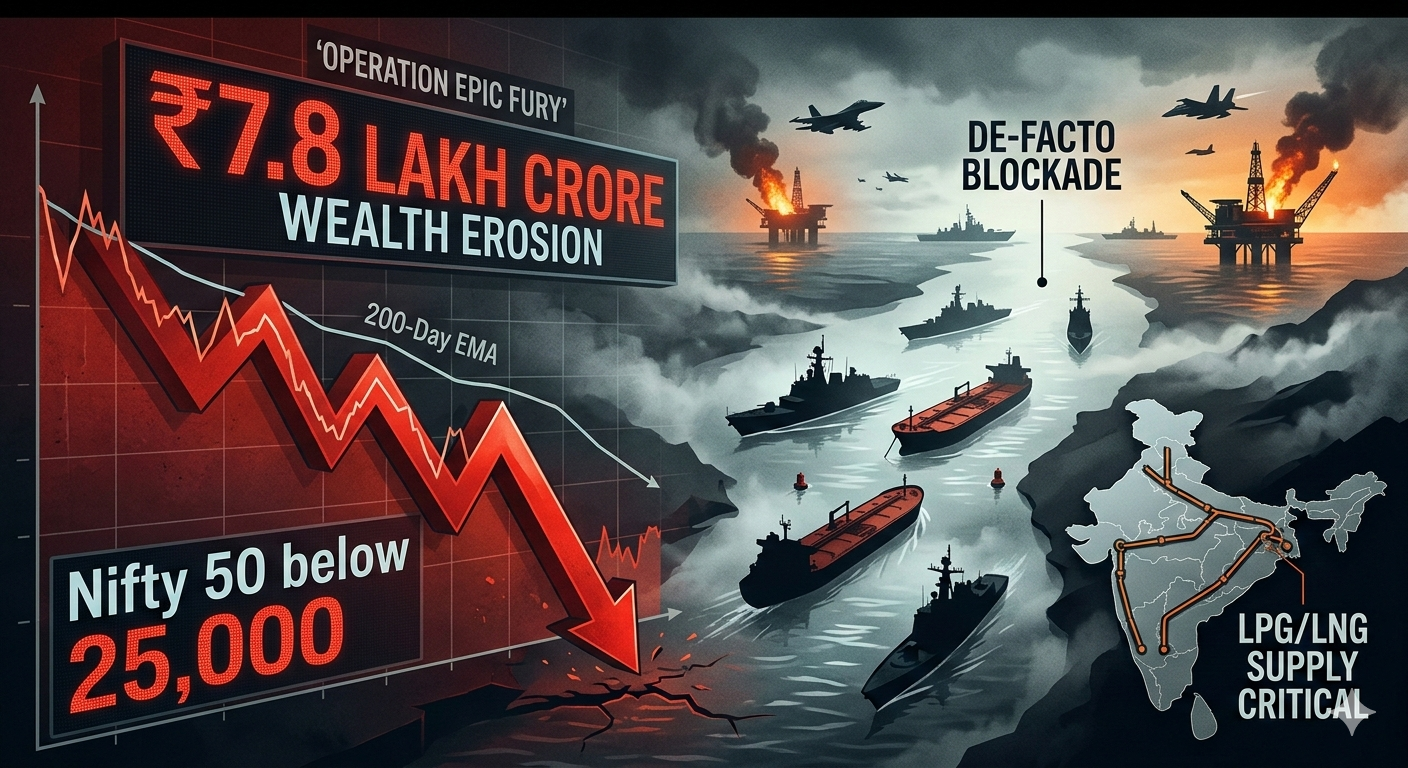
The escalation of military hostilities in the Persian Gulf during the opening days of March 2026 represents a watershed moment for global energy security and financial market stability. Operation Epic Fury, a high-intensity joint military campaign initiated by the United States and Israel on February 28, 2026, has fundamentally altered the risk-premium landscape for emerging market equities, with the Indian stock market serving as a primary focal point for this volatility. The operation, which successfully targeted the internal security apparatus of the Iranian regime and resulted in the death of Supreme Leader Ayatollah Ali Khamenei and over 40 top-ranking officials, has triggered a de-facto closure of the Strait of Hormuz. This report provides an exhaustive analysis of the Operation Epic Fury stock market impact India, deconstructing the ₹7.8 lakh crore wealth erosion observed on March 2, 2026, and identifying the logistical, sectoral, and macroeconomic shifts that will define the Indian investment landscape for the remainder of the fiscal year.
- The Kinetic Catalyst: Dismantling the Iranian Security Apparatus
- Technical Market Structure: The Breach of the 200-Day EMA
- The Hormuz Logistics Trap and the Insurance Blockade
- Structural Vulnerability: The LPG and LNG Crisis
- Sectoral Winners and Losers: A Tactical Roadmap
- Technical Analysis of Industrial Gas Users: Kajaria and Borosil
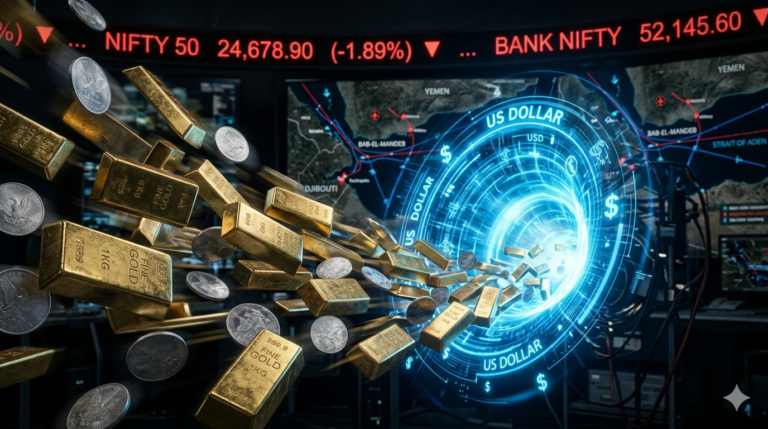
- The Safe Haven Portfolio: Gold, Silver, and US-Hedged ETFs
- India's Energy Security Roadmap: SPR Phase II Expansion
- Summary and Actionable Recommendations
The Kinetic Catalyst: Dismantling the Iranian Security Apparatus
Operation Epic Fury was not a singular event but a multi-phasic campaign designed to dismantle the command-and-control capabilities of the Islamic Revolutionary Guard Corps (IRGC). On February 28, 2026, at 01:15 ET, U.S. Central Command (CENTCOM) launched a coordinated series of precision strikes using air, land, and sea-based assets. The strategic prioritization of air defense suppression and the destruction of missile and drone launch sites across Kermanshah and Tehran provinces signaled a transition from contained deterrence to an active regime-change strategy. The deployment of B-2 Spirit stealth bombers armed with 2,000-pound guided munitions against “hardened” underground ballistic missile facilities underscores the intensity of the engagement.
Operation Epic Fury: Military Engagement Metrics and Target Summary
| Tactical Objective | Targeted Infrastructure | Asset Deployment | Strategic Outcome |
| Air Defense Suppression | IADS Command Centers, Radar Nodes | F-35, EA-18G Growler, PrSM | Neutralized Iranian SAM coverage in Tier 1 sectors |
| Command & Control | IRGC Headquarters, Ministry of Interior | B-2 Spirit (GBU-31 munitions) | Elimination of the Supreme Leader and 40 top officials |
| Strike Capability | Ballistic Missile Silos, UAV Launch Pads | Task Force Scorpion Strike Drones | Significant degradation of retaliatory strike capacity |
| Naval Neutralization | Iranian Naval HQ, Fast-Attack Craft | Carrier-Based F/A-18, Naval Gunnery | Sinking of nine Iranian navy ships; localized sea control |
The introduction of the Precision Strike Missile (PrSM) and the first combat use of Task Force Scorpion’s low-cost one-way attack drones represent a shift in the technological baseline of 2026 warfare. While Iranian forces attempted to counter the strikes with missile launches toward installations in Qatar, Kuwait, and the United Arab Emirates, the damage to U.S. and coalition assets was reported as minimal, though it caused significant disruption to commercial airspace and civilian hubs in Dubai and Abu Dhabi.
Technical Market Structure: The Breach of the 200-Day EMA
As global commodity markets opened on March 2, 2026, the Operation Epic Fury stock market impact India manifested as a severe “gap-down” opening. The Nifty 50, India’s benchmark index, slipped below the critical 25,000 mark, opening at 24,659—a decline of 2.06%. More significant than the absolute numerical decline was the index’s closure below its 200-day Exponential Moving Average (EMA) for the first time in several months. Historically, the 200-day EMA has served as the “ultimate floor” for the Indian bull market. Its breach signals a fundamental shift from a “buy on dips” environment to a “sell on rise” market, as institutional algorithms and professional traders recalibrate for a high-volatility phase.
The India VIX, a measure of expected market volatility, spiked by 20%, indicating that double-digit daily swings are becoming the “new normal” for March 2026. This volatility is driven not only by the direct military conflict but by the uncertainty surrounding the “post-Islamic Republic” power vacuum in Tehran. Without a legitimate successor coalition, the risk of fragmentation and “Iraq-style” governance gaps remains a primary concern for regional stability, embedding a permanent risk premium into Indian equities that rely on Middle Eastern energy flows.
Market Performance Indicators: March 2, 2026 Opening
| Index / Metric | Value / Change | Technical Implication |
| Nifty 50 Open | 24,659 (-2.06%) | Breach of psychological 25k support |
| 200-Day EMA | 25,488.89 | Structural shift to bearish bias (Sell on Rise) |
| India VIX | +20.00% | High-volatility regime initiated |
| NSE Market Cap Loss | ₹7.8 Lakh Crore | Significant erosion of retail and institutional wealth |
| Brent Crude Spot | $82.37 (+7.00%) | Seven-month high; inflationary trigger |
The immediate repricing of the Nifty suggests that markets are no longer driven by corporate earnings cycles but by “oil-driven” trading sentiment. In this environment, the equity multiples of mid-cap and small-cap stocks are coming under compression as rising bond yields—triggered by inflationary expectations from high crude—draw capital toward safer debt instruments.
The Hormuz Logistics Trap and the Insurance Blockade
A central pillar of the Operation Epic Fury stock market impact India is the “Logistics Trap” created by the disruption of the Strait of Hormuz. While official reports from the Joint Maritime Information Center (JMIC) indicate that there has been no formal legal closure of the strait by a sovereign state, the deteriorating security environment has created a “de-facto” blockade. The primary mechanism for this blockade is the withdrawal of maritime war-risk insurance.
More than half of the 12-member International Group of Protection and Indemnity Clubs (IG), which provide liability cover for roughly 90% of the world’s ocean-going tonnage, issued notices terminating war-risk insurance for vessels entering the Persian Gulf. Effective midnight March 5, 2026, ships operating in the Gulf of Oman and near Iranian territorial waters will find their coverage cancelled, forcing shipowners to either anchor or demand exorbitant freight rates.
The Insurance Risk Premium Escalation
| Insurance Factor | Change / Adjustment | Commercial Consequence |
| War-Risk Premiums | +50% to +60% | Massive surge in the landed cost of crude and LNG |
| Cancellation Notice | 48 to 72 hours | Inability to secure new voyages for Gulf loading |
| Dark Vessel Activity | +200% increase | Tankers switching off AIS to avoid targeting |
| GPS Jamming | 1,100+ ships affected | Navigational risk and insurance compliance breaches |
This insurance blockade effectively tightens global supply even without physical destruction of oil wells. For India, which imports nearly 85% of its crude oil and is the world’s third-largest consumer, the “Hormuz Risk Premium” translates to an immediate increase in the import bill. Analysts estimate that every $1 increase in the price of crude oil adds approximately $1.8 billion to $2 billion to India’s annual import bill, which then puts pressure on the fiscal deficit and the value of the Rupee.
Structural Vulnerability: The LPG and LNG Crisis
While Indian refiners have developed some resilience through diversified crude sourcing—particularly by pivoting toward Russian oil in the wake of previous sanctions—the more acute vulnerability lies in the gas supply chain. The Operation Epic Fury stock market impact India is disproportionately severe for the LPG and LNG sectors because, unlike crude oil, India maintains zero strategic reserves for these fuels.
India imports roughly 80–85% of its LPG requirements, with the vast majority of these supplies originating from Gulf producers like Saudi Arabia, the UAE, and Qatar. These shipments pass almost entirely through the Strait of Hormuz. In February 2026, India imported 2.03 million tonnes of LPG, of which 1.66 million tonnes were sourced from Gulf nations. With the strait under de-facto closure, the cooking fuel supply chain is exposed to immediate physical shortages and price spikes.
Comparative Vulnerability: Crude vs. LPG/LNG (March 2026)
| Commodity | Import Dependency | Strategic Reserves | Transit Route (Hormuz) | Vulnerability Level |
| Crude Oil | 88% | 74 Days (SPR + Commercial) | ~50% of imports | Moderate |
| LPG | 80-85% | 0 Days (Structural Buffer) | ~85% of imports | CRITICAL |
| LNG | ~50% | 0 Days (Buffer) | ~60% of imports | HIGH |
The LNG supply chain is equally precarious. Nearly 20% of global LNG trade transits the Strait of Hormuz, with Qatari exports accounting for the bulk of this volume. India routes approximately 54% of its LNG imports through this corridor. This gas is a critical feedstock for India’s fertilizer industry and industrial sectors like ceramics and glass. Any prolonged disruption threatens to halt production at 30 of the country’s 32 urea manufacturing units, potentially doubling the government’s fertilizer subsidy burden to over ₹1 lakh crore.
Sectoral Winners and Losers: A Tactical Roadmap
The transition to an “oil-driven” market has created a clear bifurcation between sectors that benefit from geopolitical tension and those that are crushed by rising input costs. The Operation Epic Fury stock market impact India is most visible in the pricing of “upstream” energy companies versus “downstream” consumers.
Sectoral Impact Matrix: Operation Epic Fury
| Sector | Outlook | Key Drivers | Recommended Action |
| Upstream Oil (ONGC) | Bullish | Higher realisations for domestic crude at $82+ Brent rates | Buy on momentum; watch for windfall tax risk |
| Defence (BEL, HAL) | Bullish | Global re-armament; focus on domestic drone tech (Task Force Scorpion model) | Long-term hold; E-E-A-T play |
| IT Services (TCS, Infosys) | Resilient | Rupee depreciation (₹91.43+) acts as a natural revenue booster | Hedge against INR weakness |
| Paints & Tyres | Bearish | Surge in crude-derived input costs (solvents, carbon black) | Reduce exposure; watch raw material margins |
| Aviation (IndiGo) | Severe Bearish | Double-engine hit: High ATF costs and Gulf airspace closures | Exit/Avoid until de-escalation |
| Fertilizers (IPL, Coromandel) | Bearish | LNG feedstock shortages; supply chain risk for DAP raw materials | Highly sensitive to subsidy policy |
The IT sector, led by TCS and Infosys, serves as a natural currency hedge. With the Rupee hitting a decade-low on a trade-weighted basis, these firms see a 4-6% boost in reported rupee revenue for every significant currency slide. However, the “real” state of the business remains challenged by muted discretionary spending in the West, making it a “forex play” rather than a fundamental growth story in 2026.
Technical Analysis of Industrial Gas Users: Kajaria and Borosil
Industrial sectors reliant on natural gas are facing a margin trap. For companies like Kajaria Ceramics, gas costs account for roughly 25% of the total production cost. The instability in the Persian Gulf has led to a withdrawal of slab manufacturing expansion projects due to the inconsistency and erratic pricing of natural gas in hubs like Morbi, Gujarat.
Kajaria Ceramics, the largest tile manufacturer in India, has previously faced gas cuts of 20% in Morbi, and the current crisis is expected to exacerbate these supply issues. Similarly, glass manufacturers like Borosil are expected to face “Fuel Surcharge” shocks as imported LNG becomes costlier. The “fuel and power” line item on the balance sheet for these companies will likely see a significant spike in Q4 FY26, leading to a contraction in EBITDA margins which had previously stabilized in the 15-17% range.
The Safe Haven Portfolio: Gold, Silver, and US-Hedged ETFs
In a “Red” market characterized by erosion of equity wealth, investors are increasingly pivoting toward Gold and Silver BeES. The narrative for precious metals in 2026 has shifted from steady wealth preservation to high-octane growth. Silver, in particular, has surged by 200% over the past year, reaching $94 per ounce, driven by its dual identity as a safe-haven asset and a critical component in green technology.
International Diversification: MON100 and MAFANG
For Indian investors seeking to protect their purchasing power against the falling Rupee, the Motilal Oswal NASDAQ 100 (MON100) and Mirae Asset NYSE FANG+ (MAFANG) ETFs are no longer optional. These assets gain value in Rupee terms even if the underlying US indices stay flat, as the USD/INR movement acts as a tailwind.
However, the “tracking error” in Indian-domiciled ETFs has become a point of concern for professional investors. The MON100 ETF has historically underperformed the NASDAQ 100 by up to 16% over five years due to dividend withholding taxes, cash drag, and execution costs. Direct investment in US-listed ETFs like QQQ or QQQM—while requiring a 20% TCS (Tax Collected at Source) on remittances above ₹10 lakh—provides a cleaner exposure with expense ratios as low as 0.15%.
Comparison: Indian International Funds vs. Direct US ETFs
| Investment Route | Expense Ratio | Tracking Error | Currency Hedge | Tax Complexity |
| MON100 ETF | 0.58% | 2% to 6% (Actual Difference) | Yes (Rupee-Denominated) | Familiar (LTCG at 20%) |
| Mirae FANG+ ETF | 0.65% | Significant (Concentrated) | Yes | High (Equal weight rebalancing) |
| Direct QQQ/QQQM | 0.15% – 0.20% | <0.20% | Direct USD Exposure | High (TCS at 20%, ITR filings) |
As of March 2, 2026, the Operation Epic Fury stock market impact India necessitates a portfolio rebalance where at least 15-20% of the corpus is held in USD-backed assets or Gold BeES to act as a “natural shield” against the energy shock.
India’s Energy Security Roadmap: SPR Phase II Expansion
The current crisis has underscored the urgency of India’s Strategic Petroleum Reserve (SPR) expansion. As of March 2025-2026, India holds approximately 5.33 million tonnes (MT) of emergency crude in underground caverns at Visakhapatnam, Mangaluru, and Padur. This provides roughly 9.5 days of consumption, which, combined with the 64.5 days of storage held by refiners, gives India a 74-day buffer.
The Ministry of Petroleum and Natural Gas has allocated ₹5,597 crore for the purchase of oil for SPRs in the 2025-26 budget. A second phase, involving 6.5 MT of additional capacity at Chandikhole (Odisha) and Padur (Karnataka), is underway under a Public-Private Partnership (PPP) model. The ultimate goal is to boost India’s reserve capacity to 90 days, aligning with IEA norms.
However, the “Grand Strategy” gap remains in gas storage. The lack of strategic LNG and LPG reserves means that India remains materially exposed to the “Hormuz Chokehold” for cooking fuel and industrial feedstock. Policy experts are now calling for “Strategic Gas Caverns” to be prioritized alongside oil storage to prevent similar fiscal shocks in future geopolitical flare-ups.
Summary and Actionable Recommendations
The Operation Epic Fury stock market impact India is a structural repricing event that demands a shift in asset allocation strategy. The de-facto closure of the Strait of Hormuz has created an “Insurance Logistics Trap” that will keep energy prices elevated regardless of physical supply availability.
Key Takeaways for March 2026:
- Technical Warning: The Nifty 50’s breach of the 200-day EMA at 25,488 marks the end of the “Buy on Dips” era for the current cycle.
- The Gas Vulnerability: LPG and LNG are the “Achilles’ Heel” of the Indian economy. Expect industrial margin compression in ceramics, glass, and fertilizers.
- The Dollar Shield: Use MON100 or direct QQQ exposure to hedge against the Rupee’s descent toward 92 and beyond.
- Safe Havens: Gold and Silver BeES are mandatory hedges as the “Hormuz Risk Premium” remains sticky.
- Sectoral Pivot: Long-term opportunities exist in Upstream Oil (ONGC) and Defense (BEL, HAL), while cyclical sectors like Aviation and Paints should be avoided.
https://karanpowar.in represents a commitment to radical transparency in the era of AI-driven market volatility. By merging the speed of generative research with high-quality human editorial standards, the community can 10x their strategic output without losing sight of the data-driven reality. As Operation Epic Fury continues to unfold, mastering the future of digital writing and investing will require a balanced approach where AI provides the engine, but human expertise remains the driver.
For further verification of maritime security developments, professional investors should consult official documentation such as the U.S. Maritime Advisory 2026-001 or the latest reports from the Franklin Templeton Institute regarding the “Investment Implications of Iran and Epic Fury”