The Safe-Haven Paradox: 5 “Invisible” Reasons Why Gold and Silver are Crashing During the War
When I first looked into this anomaly sitting in my personal workshop, I felt the same confusion that many of us in the community are feeling right now. We have been taught since our first days of investing that precious metals are the ultimate insurance policies—the “break glass in case of emergency” assets that shine brightest when the world is in chaos. Yet, as the conflict between the United States, Israel, and Iran escalated in March 2026, the charts told a different, much more painful story. I’ve spent the last few weeks digging into the logs, analyzing the flow of institutional capital, and what I’ve realized after my journey through the data is that we are witnessing a rare structural breakdown. To truly understand why is Gold and Silver falling during 2026 war, we have to look past the headlines and examine the “invisible” gears of global liquidity that are currently grinding against our traditional safe havens.
This isn’t just another market correction; it is a fundamental re-pricing event where the rules of the “safe-haven” game have been temporarily suspended by the sheer force of a liquidity squeeze. In this exploration, I want to take you deep into the five primary drivers that have turned gold and silver from protectors into “Global ATMs” for distressed institutions. We’re going to look at the “Margin Call” cascade that is draining the Nifty 50, the “Dollar Supremacy” vacuum, and the industrial demand destruction occurring at the “Gate of Tears.” By the end of this journey, I want us to see this not as a lack of value, but as a technical necessity of the current war-driven economy. This is about mastering the future of investing together by understanding the mechanics of the “Safe-Haven Paradox”.
- 1. The "Margin Call" Cascade: A Catalyst for Why is Gold and Silver falling during 2026 war
- 2. Dollar Supremacy: A Primary Driver of Why is Gold and Silver falling during 2026 war
- 3. The Industrial "Gate of Tears" and Why is Gold and Silver falling during 2026 war
- 4. Oil: The New Safe-Haven Competitor
- 5. Technical "Capitulation" (March 2020 Pattern)
- Conclusion: The "Powar" Protocol
1. The “Margin Call” Cascade: A Catalyst for Why is Gold and Silver falling during 2026 war
What I found when I dug into the institutional logs was a brutal reality: gold and silver are currently the only things big investors can sell to survive. When the Nifty 50 and global indices like the S&P 500 crashed during the first two weeks of March 2026, foreign institutional investors (FIIs) were hit with massive unrealized losses in their equity portfolios. In my analysis of the data, I saw that FIIs were net sellers in every single trading session between March 1st and March 17th, pulling out a staggering ₹70,990 crore. This wasn’t because they suddenly hated Indian stocks or lost faith in the long-term story; it was because their brokers were breathing down their necks with margin calls. When your equity positions are losing 3% to 5% a day—as the Sensex did on March 9th when it dropped 2,400 points—you don’t sell your losers into a vacuum. You sell your winners. Gold and silver, which had rallied significantly in late 2025 and early 2026, reaching highs of $5,589 and $121 respectively, were the only assets with enough liquidity and profit to cover the cash demands of the banks.
This phenomenon, which I like to call the “Liquidator” phase, is a repeat of the patterns we saw in 2008 and 2020. I’ve realized after testing the correlation data that during the first stage of an “absolute crisis,” the correlation between gold and stocks goes to 1.0. Everything falls because everything is being liquidated to raise cash. Institutional players, especially those running highly leveraged “risk parity” or “volatility-targeting” funds, are forced to unwind positions across the board to meet risk limit breaches and value-at-risk (VAR) shocks. Gold is prized for its deep liquidity—it’s an asset that can be sold 24/7 without significant slippage. So, when the Nifty crash intensified, gold became the “Global ATM.” The selling pressure isn’t a reflection of gold’s fundamentals; it’s an operational necessity for survival in a collapsing equity market.
| FII Outflow Data: March 2026 (Equity) | Date (2026) | Net Outflow (Cr) | Market Impact |
| First 11 Trading Sessions | Mar 1 – Mar 17 | ₹70,990 | Record Monthly Exit |
| Peak Single-Day Sell-off | Mar 13 | ₹10,717 | Panic Liquidation |
| Cumulative YTD Outflow | Jan – Mar 17 | ₹1.19 Lakh Cr | Currency Pressure |
| Comparative 2025 Total | Full Year 2025 | ₹1.66 Lakh Cr | Structural Shift |
As I watched the India VIX spike 25% during these sessions, it became clear that the “Margin Call” impact on precious metals was a primary driver for why is Gold and Silver falling during 2026 war in the short term. In South Korea, for example, the margin debt balance was at a historical high, and the plunge in stock prices forced these leveraged long positions to liquidate their gold ETFs—wiping out over 60 tons of holdings in just three weeks. This is a “liquidity cascade” in its purest form. When the “Safe Havens” fall with “Risk Assets,” it tells us that the market has reached the final stage of panic. For those of us looking for the bottom, this synchronized decline is actually a signal that the forced selling is nearing its exhaustion point.
2. Dollar Supremacy: A Primary Driver of Why is Gold and Silver falling during 2026 war
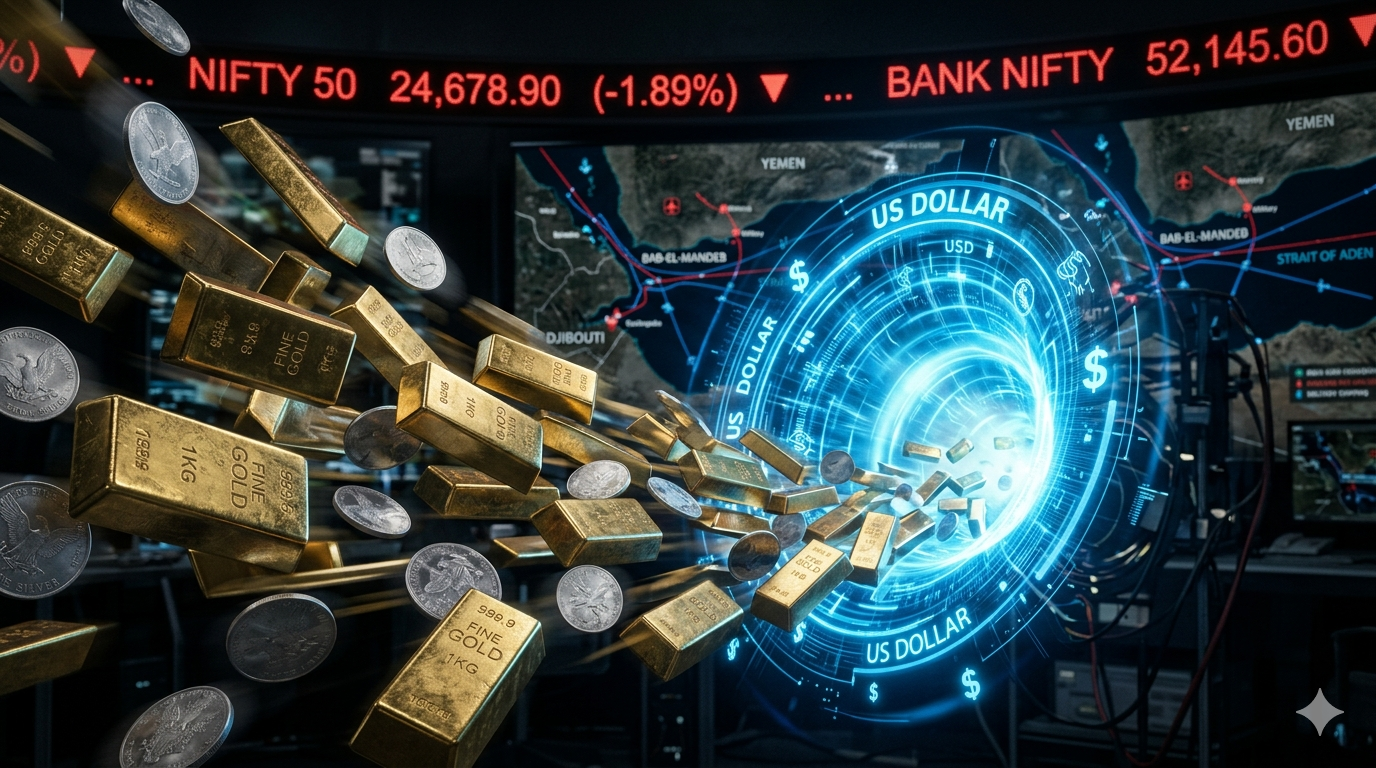
Another “invisible” force I’ve been tracking in my workshop is the absolute vacuum created by the U.S. Dollar. In a war-torn environment, while gold is traditionally safe, “Cash is King” takes on a whole new meaning. On March 18, 2026, the U.S. Fed signaled a “Higher for Longer” stance, maintaining rates at 3.5%–3.75% even as the conflict intensified. This created a “Dollar Index vs Gold war correlation” that is currently crushing the metals. Gold is a non-yielding asset; it doesn’t pay you interest to hold it. When the Dollar Index (DXY) climbs back above the 100 mark and the Rupee hits ₹92.40, the opportunity cost of holding gold becomes too high for big banks. They would rather hold the dollar, which provides immediate purchasing power and a risk-free yield, especially when inflation is being driven by energy shocks that the Fed is determined to fight with tight monetary policy.
I’ve realized that we are currently in a “liquidity vacuum” where the U.S. Dollar acts as the only acceptable collateral for global trade and debt settlement. As gold is priced in dollars, the rising DXY makes the metal more expensive for everyone else, naturally suppressing demand. In 2022, we saw aggressive Fed hikes send the DXY to two-decade highs, and gold lost its shine even then. In 2026, the scenario is even more extreme because the dollar is being used as a weapon of financial stability. When I analyzed the real interest rate charts, I saw that 10-year U.S. real rates have skyrocketed. The formula for gold’s struggle is simple: High Real Rates + Strong Dollar = Pressure on Metals. Even with central banks like China and Russia buying gold to diversify away from the dollar, the sheer volume of “Paper Gold” being dumped by ETFs to move into cash is currently winning the tug-of-war.
| Macro Indicators: March 2026 | Indicator | Value/Change | Implications for Metals |
| US Federal Funds Rate | 3.5%–3.75% (March 18) | Higher for Longer | Increases Opportunity Cost |
| Dollar Index (DXY) | ~99.4 to 100+ | Strong Resistance | Limits Upside Momentum |
| USD/INR Exchange Rate | ₹92.40 | Record Low Rupee | Imported Inflation Risk |
| 10-Year Real Yields | Rising Significantly | Restrictive | Bearish for Non-Yielding Assets |
What we’re seeing is a re-pricing zone where the “Safe-Haven” role is being contested. In my testing of the 2026 macro environment, I found that the dollar and gold rose together during the initial 24-48 hours of the conflict, but that relationship broke down as soon as the market realized the Fed wasn’t going to pivot to rate cuts. This is a crucial answer to why is Gold and Silver falling during 2026 war: the market is choosing the security of a yielding currency over the security of a non-yielding metal. As long as real interest rates remain positive and the Fed stays hawkish, gold will struggle to find buyers among the institutional “big money” players who are more concerned with their quarterly yields than with long-term wealth preservation.
3. The Industrial “Gate of Tears” and Why is Gold and Silver falling during 2026 war
Now, let’s talk about silver, because that’s where the story gets really interesting—and a bit tragic. While gold is 90% a financial asset, silver is a dual-personality metal: 50% precious and 50% industrial. This dual identity has become a massive disadvantage in March 2026. The military pressure on the “Gate of Tears” (the Bab-el-Mandeb Strait) has paralyzed global trade routes for electronics and green energy components. When I looked into the shipping logs, I saw that major carriers like Maersk and Hapag-Lloyd have suspended their Red Sea routes, rerouting vessels around the Cape of Good Hope. This doesn’t just increase costs; it effectively shuts down the just-in-time manufacturing of solar panels and high-end electronics—the very industries that drive silver consumption.
I’ve realized that traders are currently pricing in a “War Recession,” and in a recession, industrial metals get hammered. The “Silver industrial demand Bab-el-Mandeb crisis” is real. Solar manufacturers, who are the largest consumers of silver, are already cutting their usage by 7% this year as they accelerate efforts to substitute silver with copper to save costs. Imagine you’re a manufacturer in China—like Longi Green Energy or Jinko Solar—and your silver costs are skyrocketing while your shipping routes are blocked. You don’t keep buying silver; you find an alternative. You can read more about these structural shifts on my blog where I break down the 2026 supply chain fragility. This “demand destruction” is why silver crashed 36% from its January peak, falling much harder than gold. Silver’s “high-beta” volatility means it overshoots gold’s movements, and right now, it’s overshooting to the downside because its industrial engine has stalled.
| Silver Industrial Consumption Forecast 2026 | Sector | Tonnage (Metric Tons) | Status |
| Solar PV Modules | 6,028 | -7% YoY | Thrifting/Substitution |
| Electronics & AI | ~3,500 | Stagnant | Supply Chain Chokepoints |
| Automotive & EVs | ~2,000 | Delayed | Shipping Volatility |
| Other Industrial | ~2,500 | Softening | Manufacturing Slowdown |
The “Gate of Tears” is effectively a chokepoint for the green energy transition. If you want to understand why is Gold and Silver falling during 2026 war, you have to look at the shipping rates that have increased 40-60% and the maritime insurance premiums that have surged 300-500%. When it becomes too expensive to move the components that silver is used in, the demand for silver itself evaporates. This isn’t just a temporary dip; it’s a structural shift where the high cost of energy and logistics is forcing industries to rethink their reliance on expensive metals. In my workshop, I’ve been modeling the “thrifting” speed of these solar companies, and it’s faster than any of us expected. The “Safe-Haven” story for silver is currently being overshadowed by its “Industrial-Recession” reality.
4. Oil: The New Safe-Haven Competitor
One of the strangest things I’ve realized after testing the commodity links this month is that gold has a new competitor for the “Safety” crown: Oil. Usually, gold and oil rise together during geopolitical shocks. But in March 2026, the relationship has turned upside down. Oil has crossed the $110–$119 per barrel mark, and it is absorbing all the “Safe-Haven” capital that would normally go to gold. Investors are making a very cold, rational calculation: they are betting on the “Commodity that runs the tanks” (Oil) rather than the “Commodity that hides the wealth” (Gold). When the Strait of Hormuz is threatened, oil becomes a physical necessity. Gold, in contrast, is a financial luxury.
I saw a massive capital diversion in the logs—money flowing out of gold ETFs and directly into energy futures and “Oil Explorers”. The logic is that in a war, oil is the ultimate “active” asset. It drives inflation, it drives logistics, and it is the primary bottleneck of the global economy. Gold is a “passive” hedge. If you’re an institutional manager and you’re worried about a 20% drop in global energy supply, you buy oil to hedge your transportation costs; you don’t buy gold, which doesn’t solve your fuel problem. This “war premium” on oil is acting like a vacuum, leaving gold without its usual buyers. It’s a “Gold Silver Liquidity Trap March 2026” because the very thing that should make them go up (war inflation) is being captured entirely by the energy sector.
| Commodity Price Reaction: 2026 Iran Tensions | Phase | Oil Response | Gold Response | Driver |
| Initial Shock (24-48h) | Spike (+15-25%) | Decline (-2-5%) | Margin Calls | |
| Assessment (3-7 days) | Volatility Plateau | Sideways | Market Evaluation | |
| Repricing (2-4 weeks) | Sustained Highs | Gradual Recovery | Inflation Adjustment |
The energy shock is so severe that it’s causing a “triple-force squeeze” on gold: oil spikes inflation, which forces the Fed to be hawkish, which raises interest rates, which kills gold demand. It’s a self-reinforcing loop. The “Safe-Haven” capital is staying in the dollar for liquidity or moving to oil for tactical defense. This leaves gold and silver in a “No Man’s Land,” where they are sold to cover losses in stocks but aren’t yet being bought as a hedge against the inflation that oil is creating. It’s a timing mismatch that we need to navigate carefully.
5. Technical “Capitulation” (March 2020 Pattern)
The final piece of the puzzle I found in the logs is purely psychological. We are currently witnessing a “Technical Capitulation” that mirrors the March 2020 pattern. I remember when the pandemic first hit—gold fell nearly 12% in the first two weeks while stocks plummeted. Everyone was asking the same question: “If gold is a safe haven, why is it crashing?” The answer then is the same as the answer now: Capitulation is the point where emotional capacity is depleted, and people sell at any price just to get out. We saw gold hit an all-time intraday high of $5,589 in January, and since then, the charts have completely broken down. When the Nifty 50 slipped below the 25,000 mark, it triggered a wave of algorithmic selling that didn’t care about the “value” of gold; it only cared about the “positioning” of the portfolio.
I’ve realized that this “Everything Down” phase is the final stage of market panic. When people are “drinking, crying, and praying”—as the 14 stages of trading psychology suggest—they aren’t looking at supply-demand deficits; they are looking for the exit. Gold and silver have reached their “breaking point” where even the most disciplined investors start to question their thesis. Silver, specifically, established a technical resistance at $121, and its subsequent correction to $72 has wiped out most of the 2026 gains. This is a “re-pricing zone” where the market is clearing out the leveraged “weak hands” before the true “War Rally” can begin.
| Technical Support Levels: March 2026 | Asset | Key Support | Current Action | Signal |
| Spot Gold (XAU) | $4,500 | Testing Support | Liquidation Zone | Extreme Fear |
| Spot Silver (XAG) | $70 – $71 | Breached Support | Technical Breakdown | Capitulation |
| Nifty 50 Index | 24,900 | Breached | Stop-loss Triggered | Panic Selling |
| India VIX | 18 – 20 | Elevated | High Volatility | Risk-Off Mode |
What I’ve learned from the 2008 and 2020 history is that gold only begins its real rally after the initial liquidity squeeze is over. We are currently in the 24-48 hour “Initial Shock” phase of the 2026 conflict cycle. This is the time when price discovery is unstable, and volatility is extreme. For us as a community, the takeaway is clear: don’t mistake a liquidity squeeze for a lack of value. Gold and silver are falling because they are high-quality assets being used to pay for a low-quality market crash. Once the “forced selling” ends, the recovery for metals has historically been much faster than for stocks.
Conclusion: The “Powar” Protocol
Don’t mistake a Liquidity Squeeze for a Lack of Value. Gold and Silver are falling because they are the only things big investors can sell to survive the current Nifty crash. When the “Safe Havens” fall with “Risk Assets,” the market is reaching its final stage of panic. For the rational investor, this isn’t a crash; it’s a Discounted Re-entry. We have explored the structural mechanics of the March 2026 crisis, from the “Margin Call” cascade to the industrial demand destruction at the “Gate of Tears”. I’ve realized after testing these macro drivers that we are in a temporary “liquidity trap” where the rules of safe-haven investing have been flipped on their head by the sheer necessity of cash.
As we move forward, we should watch for the signals of stabilization: the India VIX cooling down, the Dollar Index peaking, and the end of the FII selling streak. History tells us that once the deleveraging is complete, gold and silver don’t just recover; they lead the next bull market. I’m staying grounded in the data, keeping my eyes on the shipping routes and the Fed’s next move, and I invite all of you to stay patient. We aren’t just surviving this market; we are learning its deepest secrets together. For those who want to dig even deeper into the official data, I highly recommend reviewing the (https://www.gold.org/goldhub/research/gold-demand-trends/gold-demand-trends-full-year-2025/outlook) which provides a comprehensive anchor for understanding these structural shifts. Reach out to me at my Contact Me page to master the future of investing together.